Correlation with Hydrologic Observations
Peak comparison figures between US‑GDI and independent hydrologic observations across HUC2 regions. Explore relationships with stream discharge, reservoir elevation and storage, and groundwater wells.
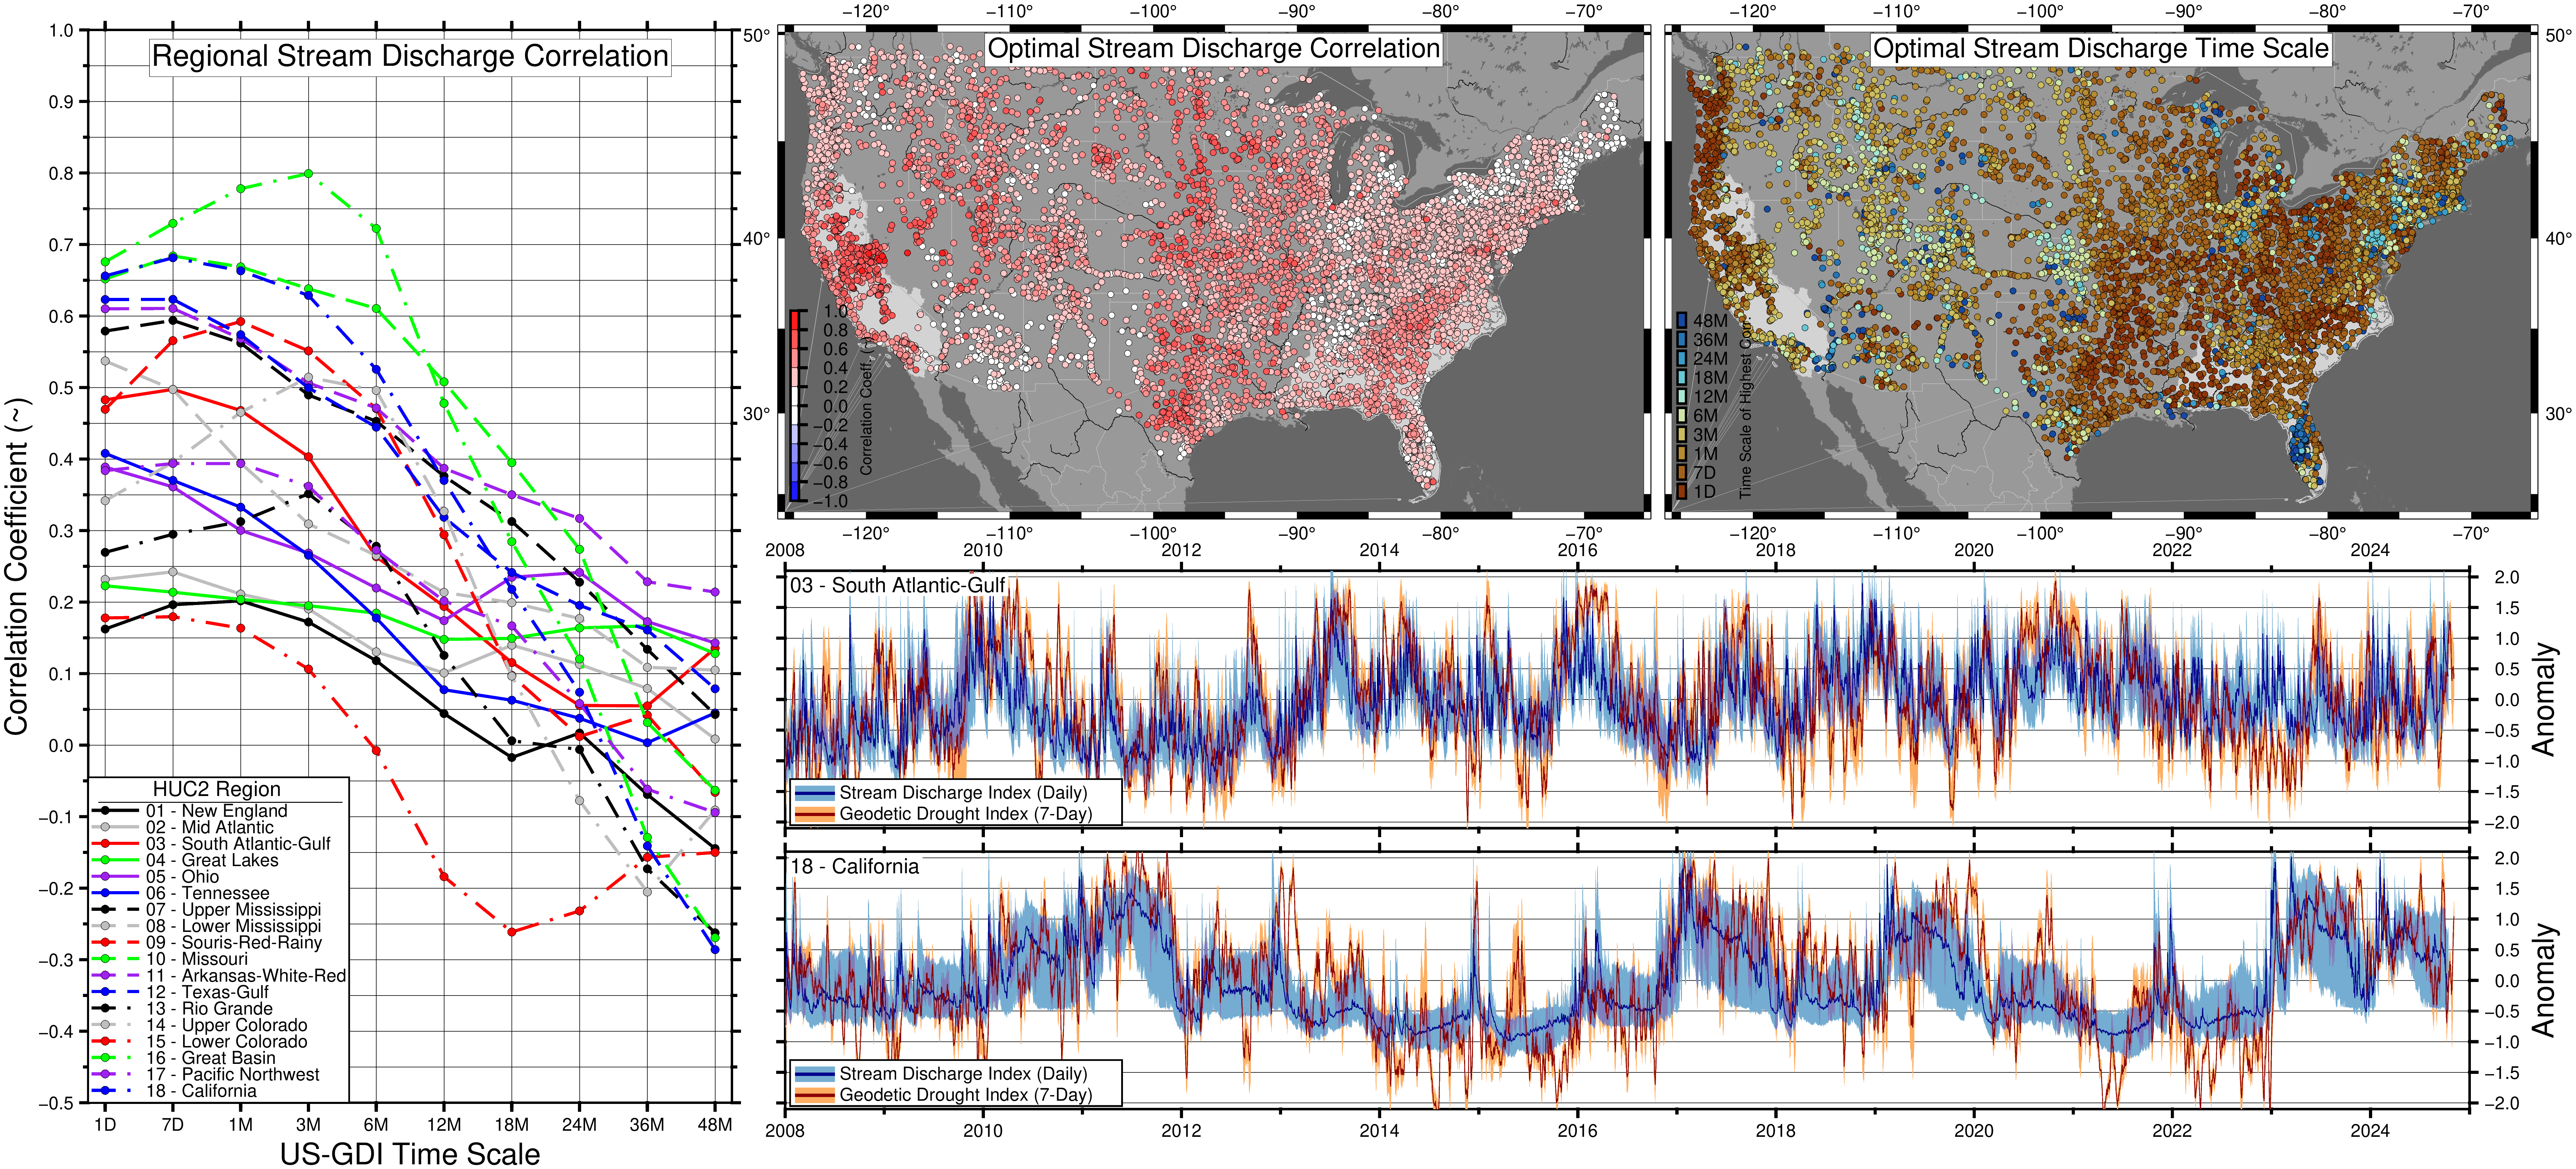
Figure 1. Comparison of the US‑GDI with stream discharge observations across the United States. (a) Correlation coefficients between the median US‑GDI for each time scale co‑located with the median stream discharge anomaly within each HUC2 region. Stream discharge anomalies are calculated by passing the time series through the GDI calculation at the daily time scale (no smoothing is applied). Regions which do not contain at least 12 hydrologic stations are omitted and indicated by grey text in the legend. (b) Peak stream discharge correlation coefficients by station and (c) their optimal time scale. (d) Median time series and IQR for Missouri and (e) California HUC2 regions. Sources: NWIS and GRDC (USGS, 2024; GRDC, 2024).
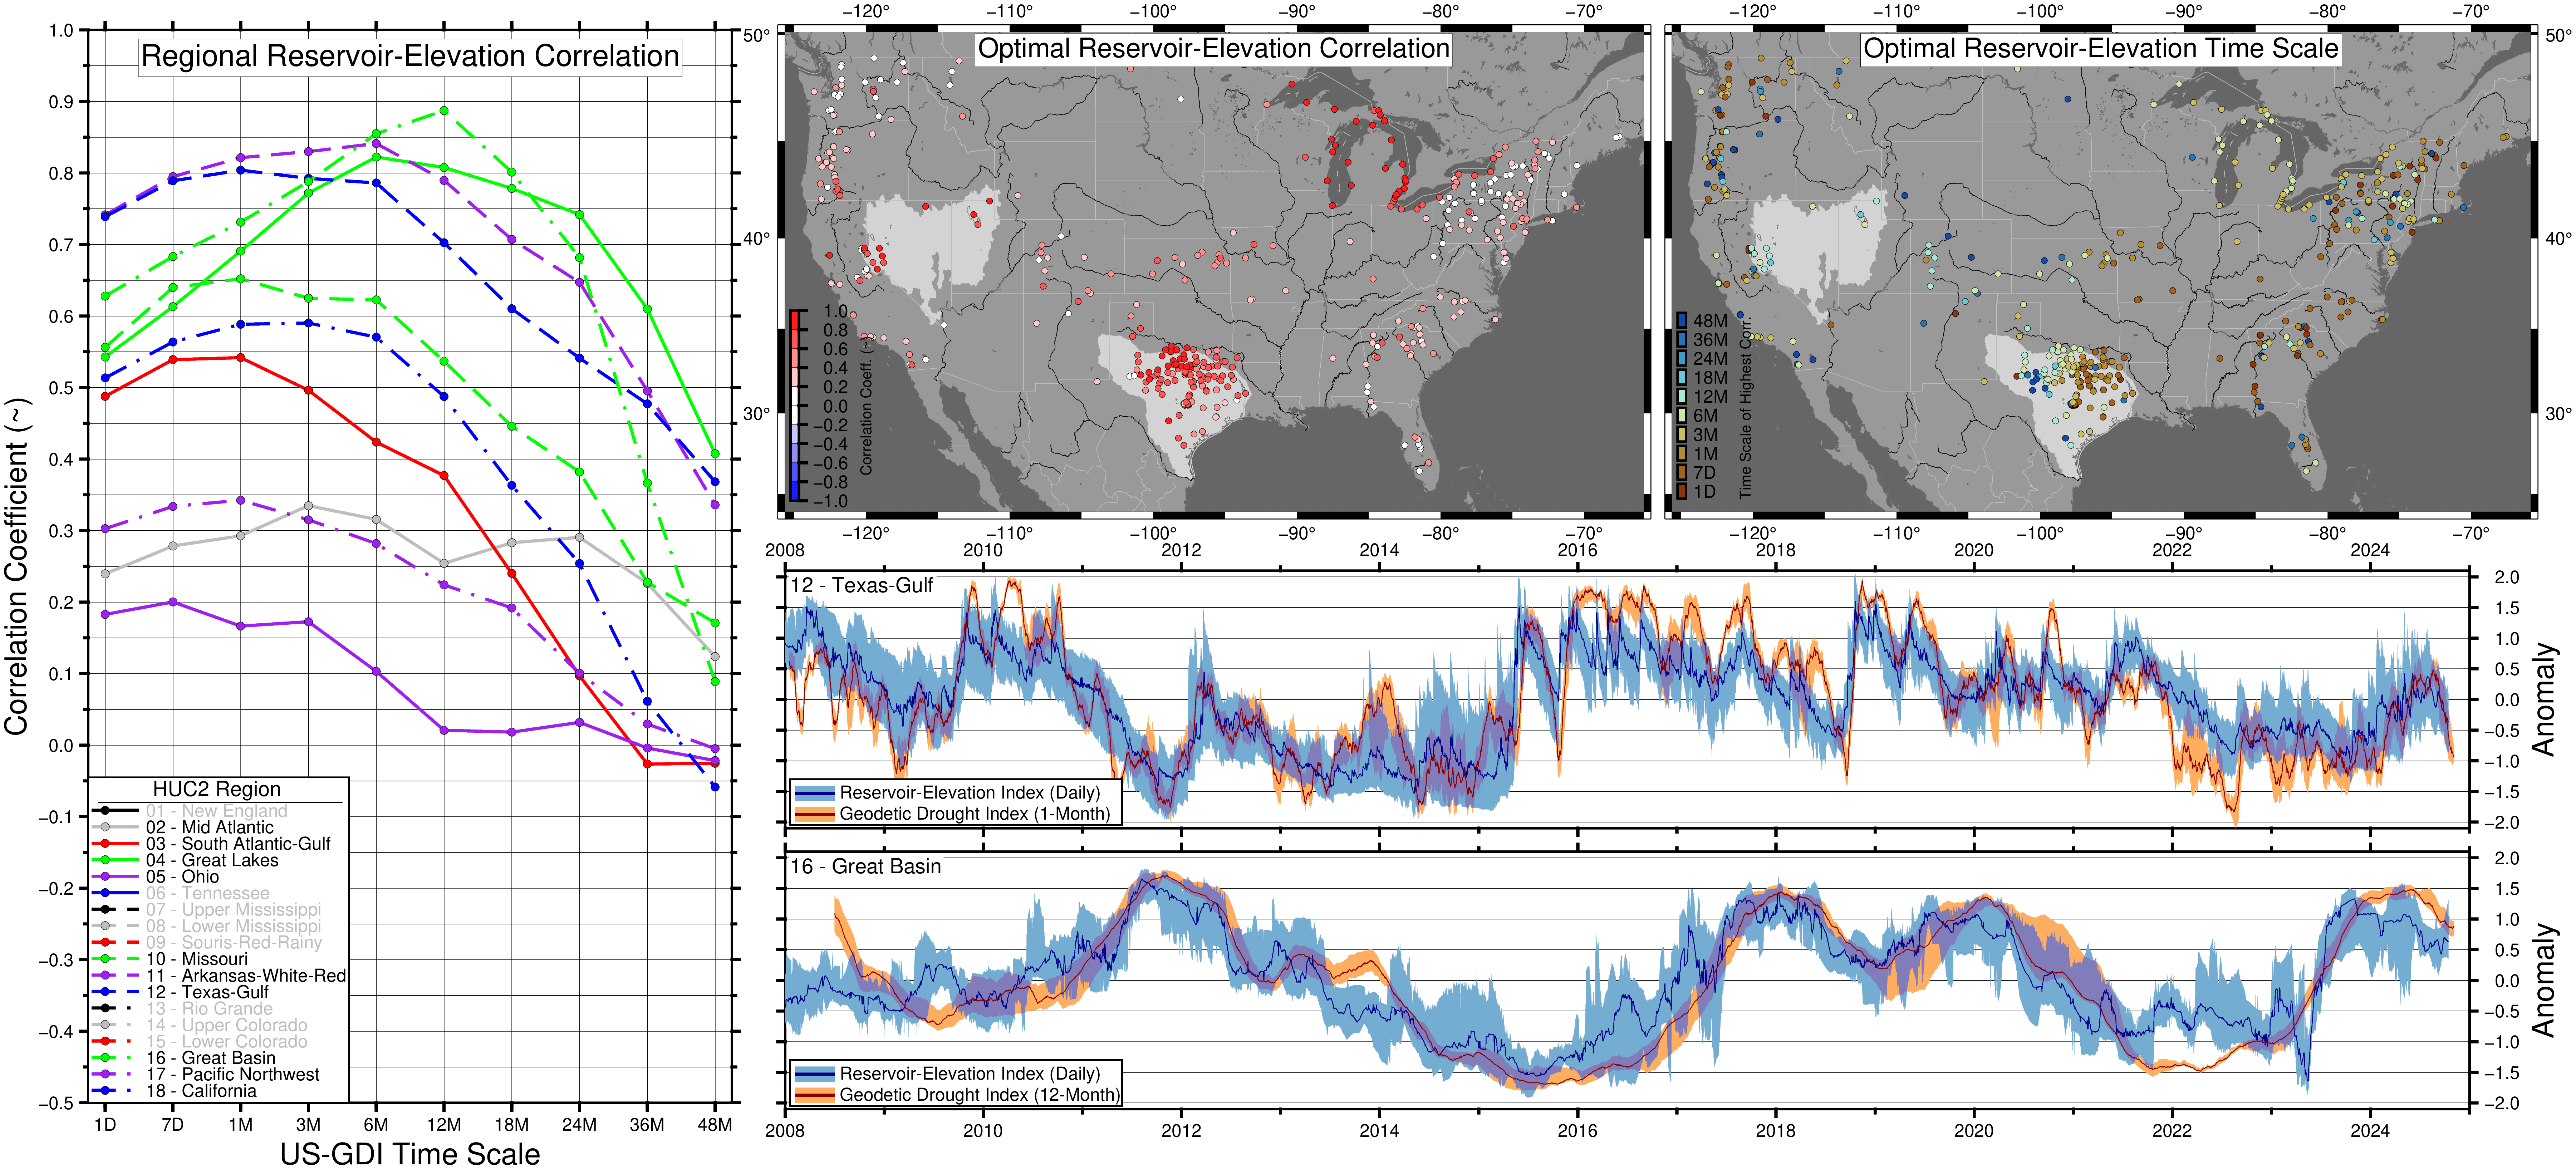
Figure 2. Same as Figure 1 but against surface‑reservoir elevation. Time series in (d) and (e) reflect Texas‑Gulf and Great Basin regions, respectively. Sources: NWIS, CDEC, Co‑Op (USGS, 2024; CDEC, 2023; NOAA, 2024).
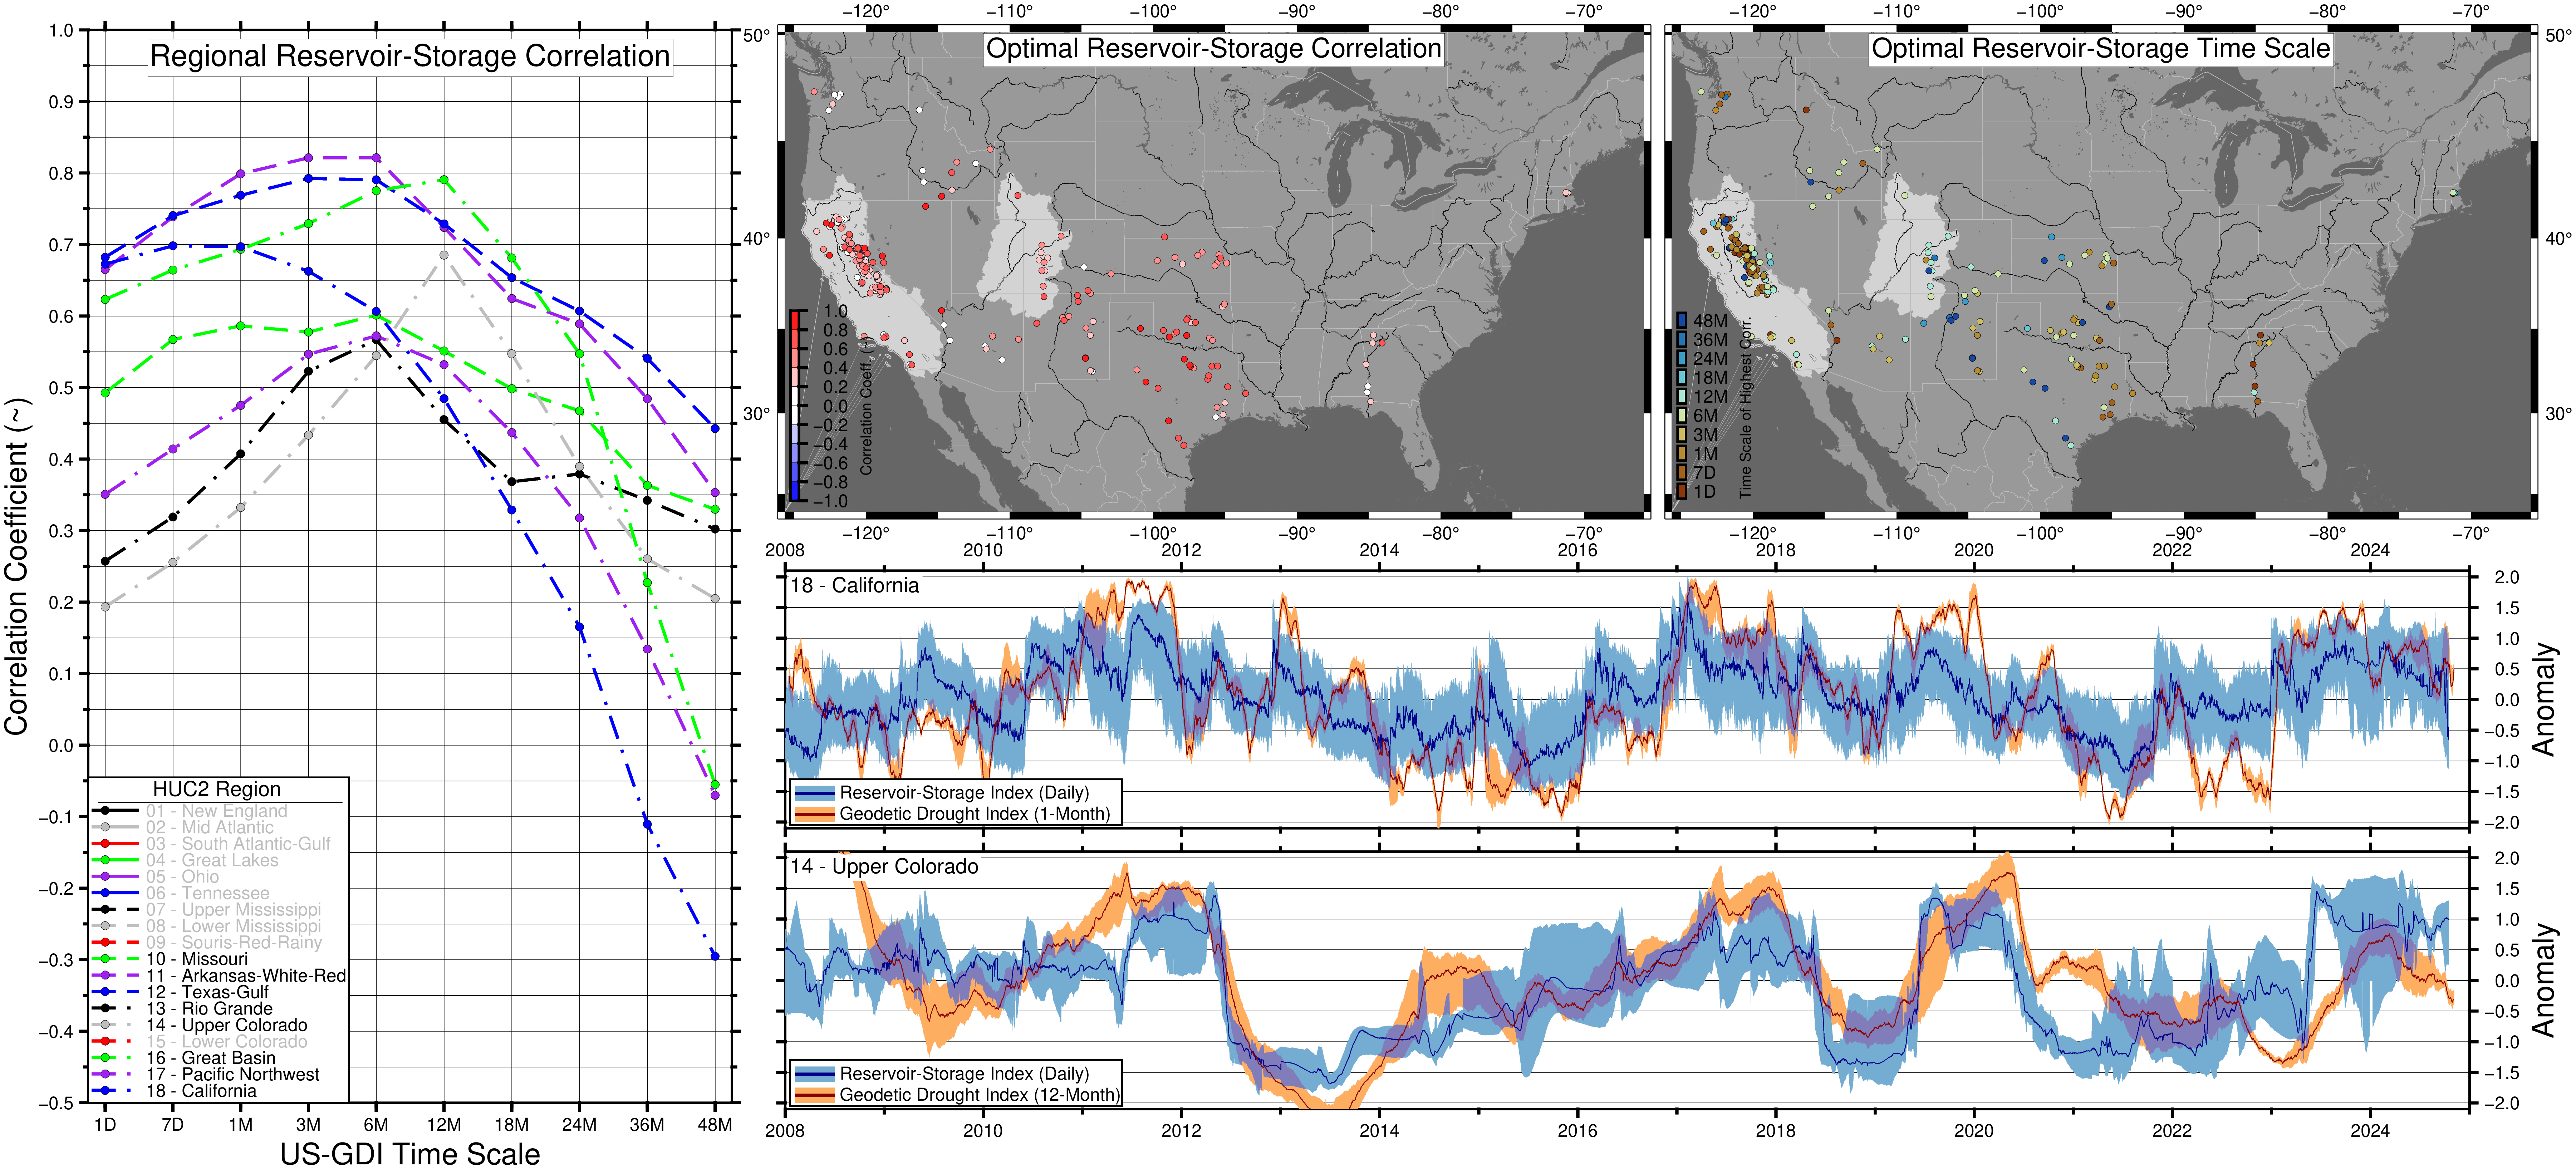
Figure 3. Same as Figure 1 but against surface‑reservoir storage. Time series in (d) and (e) are California and Upper Colorado. Sources: NWIS and CDEC (USGS, 2024; CDEC, 2023).
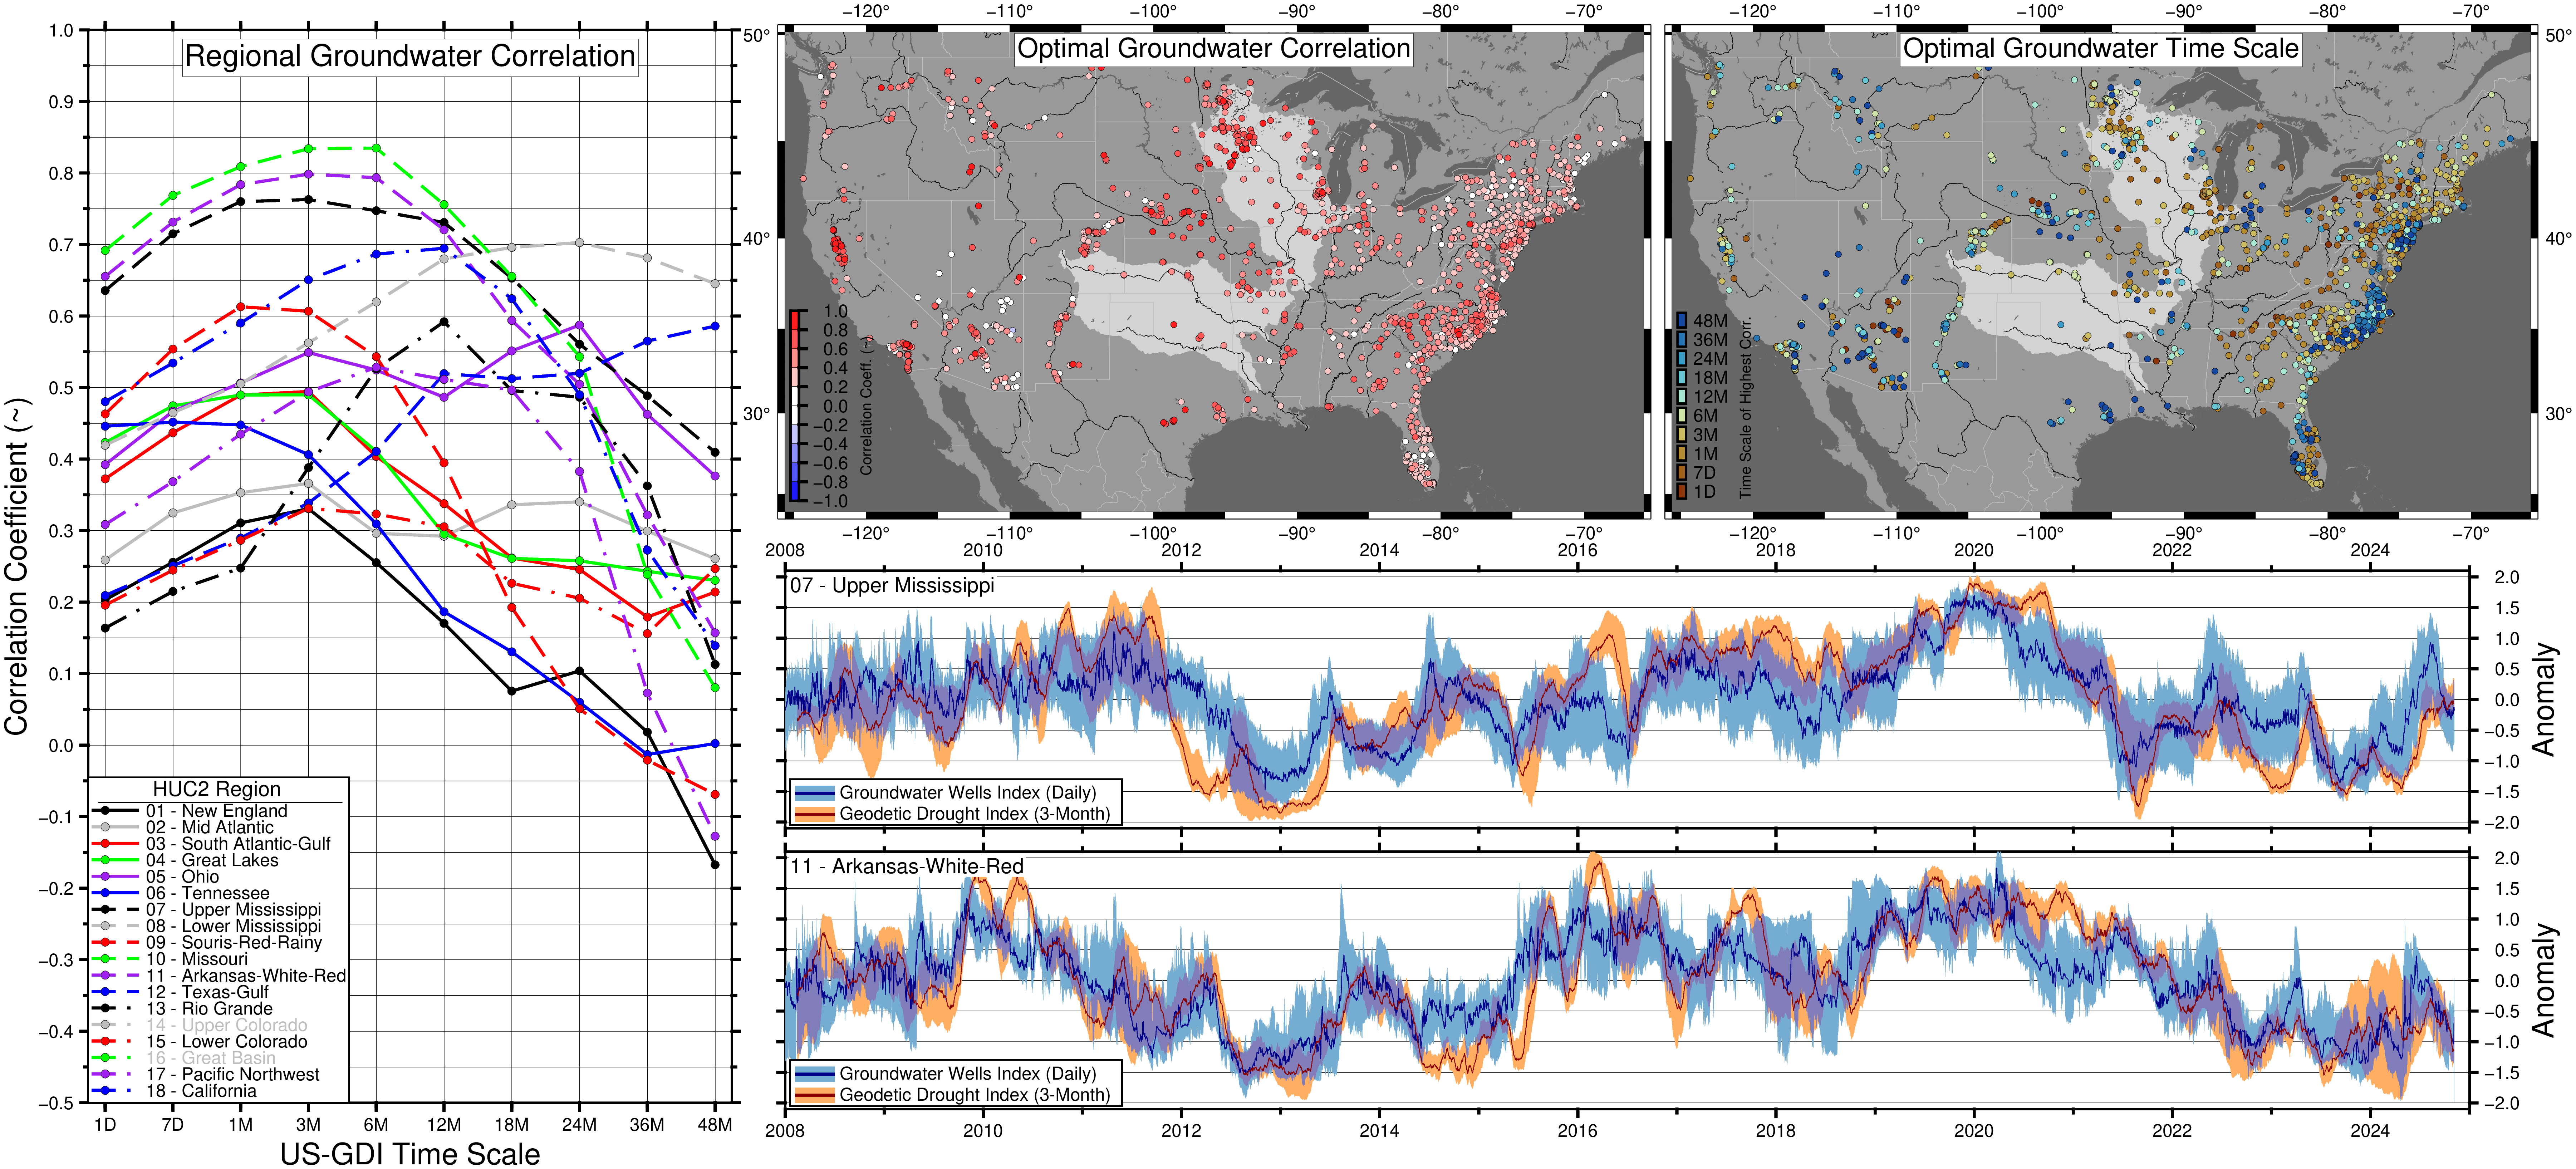
Figure 4. Same as Figure 1 but against groundwater wells. Time series in (d) and (e) are Upper Mississippi and Arkansas‑White‑Red. Sources: NWIS and GGMN (USGS, 2024; GGMN, 2024).